Lab: Network Security Monitoring and Security Onion
Learn your network before an intruder does
- SecurityOnion
If, when you try to start the lab-security-onion virtual machine within
virt-manager, you get an error message saying:
"Error starting the domain: Requested operation is not valid: network 'vagrant-libvirt' is not active"
...then run the following command from a kali terminal as root, which will start the network as part of launching the vm.
cd /root/vagrant-boxes/lab-security-onion && vagrant up
Part 1: Analyzing NetFlow information
Although full-content data are powerful, they are less useful for fast querying and timely incident response. This is where NetFlow records, some of the most powerful information sources available to incident responders, become very useful. These records are brief summaries of network traffic which can be maintained indefinitely due to their small file size. They provide a running history of network connections at the time of an incident. Read the below article and use Google to answer the following questions:
https://en.wikipedia.org/wiki/NetFlow
Now that you have basic understandings of NetFlow, we will use YAF and SiLK (open-source incident response tools for Linux) to analyze NetFlow data. Further documentation can be found at https://tools.netsa.cert.org/silk/.
We will analyze sample data hosted here (already downloaded to the security-onion virtual machine). The data source page says the following about the data source:
This sample data is derived from anonymized enterprise packet header traces obtained from Lawrence Berkeley National Laboratory and ICSI, and is used here with their permission. This data covers selected hours on selected dates in late 2004 and early 2005.
-
On your securityonion virtual machine, open a terminal. One way to do this is to right-click the desktop and choose
Open Terminal. -
First, you should run the following commands in your terminal for the start and end dates to filter on:
export sd="--start-date=2004/10/04:20"
export sd="$sd --end-date=2005/01/08:05"
These commands just set a convenience variable called
$sdthat let you not have to type out the--start-dateand--end-dateflags for each of the following commands. You can view it by runningecho $sd.Theseexportcommands will only persist for the current terminal session. If you open a new terminal and use any of the commands in this section that rely on the$sdvariable, you will get an error.We can now start querying the sample data to find some interesting and important information about the sample network.
All commands that start with
rware part of the SiLK Tool Suite.rwfilterfirst selects records from netflow files, andrwstatssummarises those records. -
Query the top “talkers” (those host-pairs that send and receive the most traffic) by bytes.
Run all of the following, as one command.
rwfilter --data-rootdir=/data/SiLK-LBNL-05 --protocol=0- \
    --type=all $sd --pass=stdout \
    | rwstats --percentage=1 --fields=sip,dip --bytes
The backslash "\" character lets a single command span multiple lines.Note:
- This command uses
rwfilterto parse the source data, and then calculates statistics on that data usingrwstats. - The
-at the end of--protocol=0-indicates that all protocols from0and above will be included. It is equivalent to--protocol=0-255. See the wikipedia page on IP protocols for a list of IP protocols and their numbers. -
The
sipanddipfields stand for source and destination IP respectively.All network traffic records have “sources” and “destinations.” To understand “source” and “destination” terminology, consider the client-server architecture pattern. For example, when the
sshcommand is run to connect to ansshdservice listening on another computer, the connecting computer is the “source,” and the connection target is the “destination.” - The
--percentage=1flag specifies that we only want to retain asip,dippair if total bytes exchanged between the two comprised at least 1% of total network byte traffic. The--fieldsconceptually performs a “group-by” on the incomingrwfilterdata for, in this case, uniquesip,dippairs. Then the--percentageflag filters based on ranked group aggregate values for, in this case,--bytes.
Question : Looking at the output, take note of the top 5 talkers source and destination IPs, ranked by the % of bytes the pair generated. - This command uses
-
Query “top talkers” (those host-pairs that send and receive the most traffic) by the number of netflow records they generated:
rwfilter --data-rootdir=/data/SiLK-LBNL-05 \
  --proto=0- --type=all $sd \
  --pass=stdout | rwstats --count=25 \
  --fields=sip,dip
Note: The
--count=25flag specifies that we only want to retain asip,dippair if the number of netflow records associated with traffic exchanged between that pair was in the top 25 of all netflow-record pair-counts.Question : Take note of the source and destination IPs of the top three talker-pairs, ranked by number of flow records.Consider: Conceptually, why do you think it’s important information to know the top talkers on the network? -
Query top SSH flows. This is typically done using a destination port (
dport) filter for port 22, as follows:rwfilter --data-rootdir=/data/SiLK-LBNL-05 \ --proto=0- --type=all $sd \ --dport=22 --pass=stdout | rwstats --count=10 \ --fields=sip,dipQuestion : Take note of the host IP address that has the greatest number of flow records associated with ssh’ing to another specific host.Consider: will thesIPordIPrepresent the ssh- connection initiator, if the destination SSH port is 22? -
Starting from the query in the previous step, do a follow-up analysis on a particular SSH-connection-starter.
Take heed! This question intentionaly offers minimal guidance.-
Write a query using a
rwfilterflag to select only records associated with a single ip address. Filter to only SSH
connections initiated by128.3.161.229.To learn how to do this, either use
rwfilter --helpand browse through the “partitioning switches” section, or read those same help docs hosted online here (recommended). - Pipe the output of
rwfiltertorwstats. - Use
rwstatsto group by unique source ip and destination ip addresses, and examine the pairs with the 10 highest total number of ssh flow records.
Question : What are the top SSH destination IPs for128.3.161.229? In other words, what hosts is this box SSH’ing to the most often? -
-
Query for long-standing SSH traffic:
rwfilter --data-rootdir=/data/SiLK-LBNL-05 \
  --proto=0- --type=all \
  --dport=22 --duration=1700- \
  $sd --pass=stdout | rwsort --fields=duration | rwcut --fields=sip,dip,duration
Note:
rwcutconverts the binary output ofrwfilterinto human-readable text. Per therwcutmanpage, “rwcut reads binary SiLK Flow records and prints the user-selected record attributes (or fields) to the terminal in a textual, bar-delimited (|) format.”- In this example,
--duration=1700-and--dport=22filters to only records with an ssh connection time of at least 1700 seconds (almost 30 minutes). rwsortsorts the records by the “duration” field.- The
--fieldsargument torwcutfilters which columns are shown. Try running the command without this argument.
Question : What is the IP address of the source that had an ongoing SSH session of at least 30 minutes?Reflect: Conceptually, why should we look for long standing SSH connections?
There are many other filters that we can use to analyze network traffic, especially for incident response purposes.
To learn more about YAF and SILK, you can find additional material on https://tools.netsa.cert.org/
Part 2: Examining PCAP Files
In this section, you’ll examine the network traffic for a Windows VM that browsed to a compromised website that in turn referred the Windows VM to a server that delivered malware to the Windows VM. You’ll use Squert and Wireshark to investigate these events.
From SquertProject.org:
“Squert is a web application that is used to query and view event data stored in a Sguil database (typically IDS alert data). Squert is a visual tool that attempts to provide additional context to events through the use of metadata, time series representations and weighted and logically grouped result sets. The hope is that these views will prompt questions that otherwise may not have been asked.”
(IDS stands for Intrusion Detection System.)
-
Ensure that IDS signature rule 2000419 is enabled.
The following steps in this lab rely on a snort rule being enabled in securityonion that will detect a windows EXE being downloaded over a non-standard HTTP port.
The signature rule we want to enable is 2000419. Follow the link and examine the rule. Note that when this rule is triggered, it will write “ET POLICY PE EXE or DLL Windows file download” or “ET POLICY PE EXE or DLL Windows file download Non-HTTP”, depending on the rule version in use.
This signature is in a list of rules downloaded by PulledPork, which securityonion uses to manage IDS rules. By default, it is disabled. Ensure that it is enabled by adding id 2000419 to a pulledpork config file (If asked, the password is
Password1):grep -qxF '1:2000419' /etc/nsm/pulledpork/enablesid.conf || echo '1:2000419' | sudo tee -a /etc/nsm/pulledpork/enablesid.conf sudo rule-update -
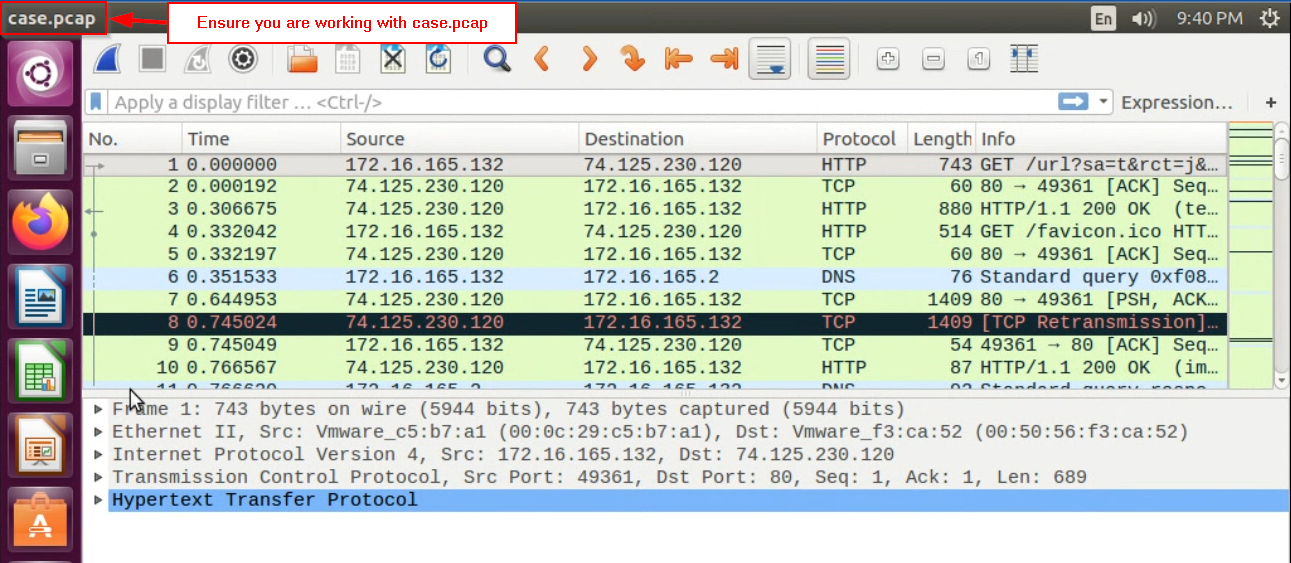
Navigate to the
/datadirectory, and downloadcase.pcapusing the following command:/data$ sudo wget -O case.pcap https://github.com/deargle/lab-security-onion/raw/master/case.pcapThen, run the following command to replay network traffic stored in the
case.pcapfile onto security onion’s network card, as if the network activity were happening again, live./data$ sudo tcpreplay -i eth1 -M 10.0 case.pcapYou should see the following at the end of your output (ignore the error messages for the 20 failed packets):
Statistics for network device: eth1 Attempted packets: 4682 Successful packets: 4662 Failed packets: 20 Retried packets (ENOBUFS): 0 Retried packets (EAGAIN): 0 -
Log in to Squert using the icon on the Security Onion desktop using
analyst:analystfor the username:password. (Bypass the SSL warning by clicking “Advanced” then “Proceed to site.”)If you get a blank screen while trying to use Squert, then copy-paste the squert web address into an "incognito" window within security onion's web browser.If a popup asks you to to “Choose password for new keyring,” you can safely dismiss/cancel this popup twice to dismiss it.
-
Each row in Squert lists an IDS event. Click on the
QUEUE “2”button on the row withET POLICY PE EXE or DLL Windows file downloadto see the detail of this alert.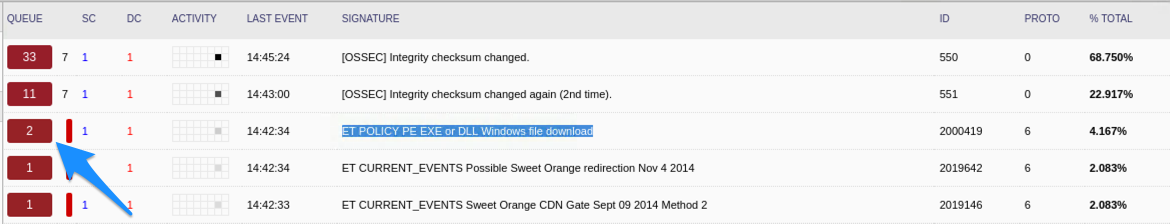
When you click this number, more details will appear below the accordion expansion, including the source and destination IP of the associated IDS event.
Note: This particular record is a response to a HTTP web browser request which downloaded a malicious executable payload. Because it is a response, the source IP represents the attack machine, and the destination IP represents the victim machine. This convention will not always hold for this case analysis – it depends on whether a query or a response is being examined.
Question : What is the IP address of the Windows VM to where the malware payload was sent (the destination IP)?Question : What is the IP address of the host that sent the malware payload? (the source IP)?You can also click on the Summary tab to see a map and summary of traffic by countries.
If the map isn’t working, just search for the IP address using Wolfram-Alpha. Or, follow the instructions in the box below to update your map.
Question : What country does this malware payload comes from?If you don't have any country information showing:- first make sure that you have an internet connection (try `ping google.com`).
-
If you can't ping google.com, run this:
sudo ifdown eth1 && sudo ifup eth1 -
Once you can ping google.com, run this:
cd /var/www/so/squert/.scripts sudo ./ip2c.tcl -
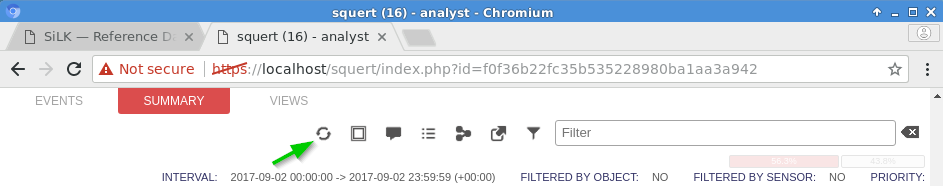
Then press Squert's "Refresh" button (not the browser refresh button):
-
You can pivot from Squert to other network forensics tools for follow-up analyses. From the Events view, drill-down one level deeper by clicking on the second
QUEUE “2”button that appeared after clicking on the first. You should now see two events. Click on one of these “event ids.” Doing so will pivot you to another tool calledCapME.If required, log in with username:passwordanalyst:analyst.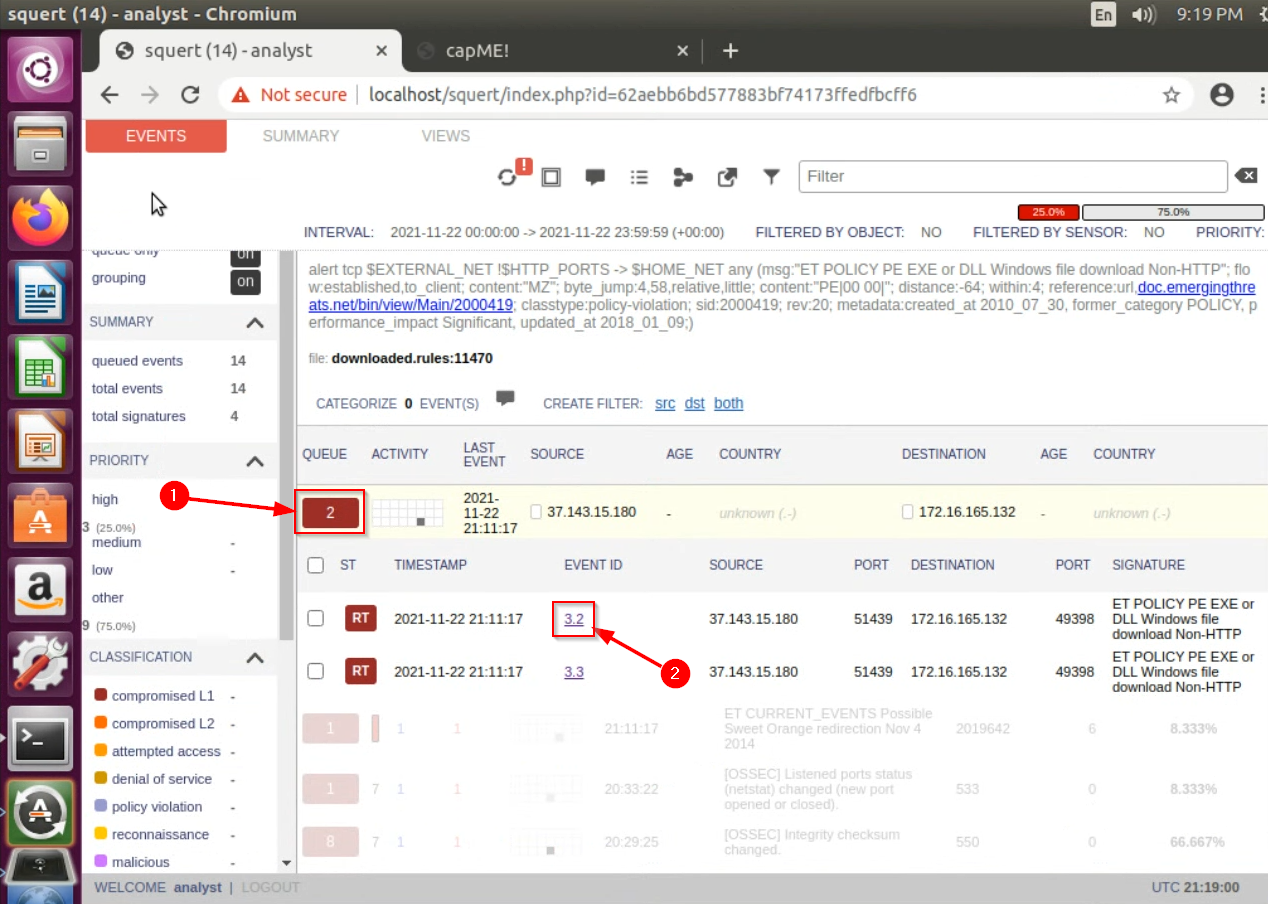
After a moment, you will see a representation of the HTTP web request which fetched and downloaded the malware payload. In red text is the HTTP request that the browser made for the download, and in blue text is the malicious server’s response in which the payload was actually downloaded.
In the RED text, you should see a
HOSTheader, as well as aGETheader.- The
HOSTheader shows the domain name and port that the browser requested. This is the malicious web domain. - The
GETheader shows the specific URL that was requested that delivered the malware payload.
Question : What is the domain name that served the malicious payload?Feeling saucy? If the host were still serving the malware, you could theoretically combine the HOST and the GET values and paste them into your browser, and download the malware anew! But there is no need to do this if it is the malware you seek. You already can extract it because you have a record of the entire malware download network activity. This is the power of NSM -- to know all, see all, recreate all, for anything going to or sent from anyone on your network (assuming it's not encrypted).For enrichment:
-
Examine the url of the capME! page. Note the url parameters’ similarities to the SiLK commands run in Part 1 of this lab.
https://localhost/capme/?sip=37.143.15.180&dip=172.16.165.132&spt=51439&dpt=49398&stime=1637611877&etime=1637619077&filename=squert -
Scroll to the bottom and note that sql was used by CapME to query for the transmission:
QUERY: SELECT event.timestamp AS start_time, s2.sid, s2.hostname FROM event
LEFT JOIN sensor ON event.sid = sensor.sid LEFT JOIN sensor AS s2 ON
sensor.net_name = s2.net_name WHERE timestamp BETWEEN '2021-11-22 20:11:17'
AND '2021-11-22 22:11:17' AND ((src_ip = INET_ATON('37.143.15.180') AND
src_port = 51439 AND dst_ip = INET_ATON('172.16.165.132') AND dst_port =
49398 ) OR (src_ip = INET_ATON('172.16.165.132') AND src_port = 49398 AND
dst_ip = INET_ATON('37.143.15.180') AND dst_port = 51439 )) AND
s2.agent_type = 'pcap' LIMIT 1
- The
-
At the top and on the bottom of the CAPme report, you will see links to download a
.pcapfile. Do so, then open the download from the browser.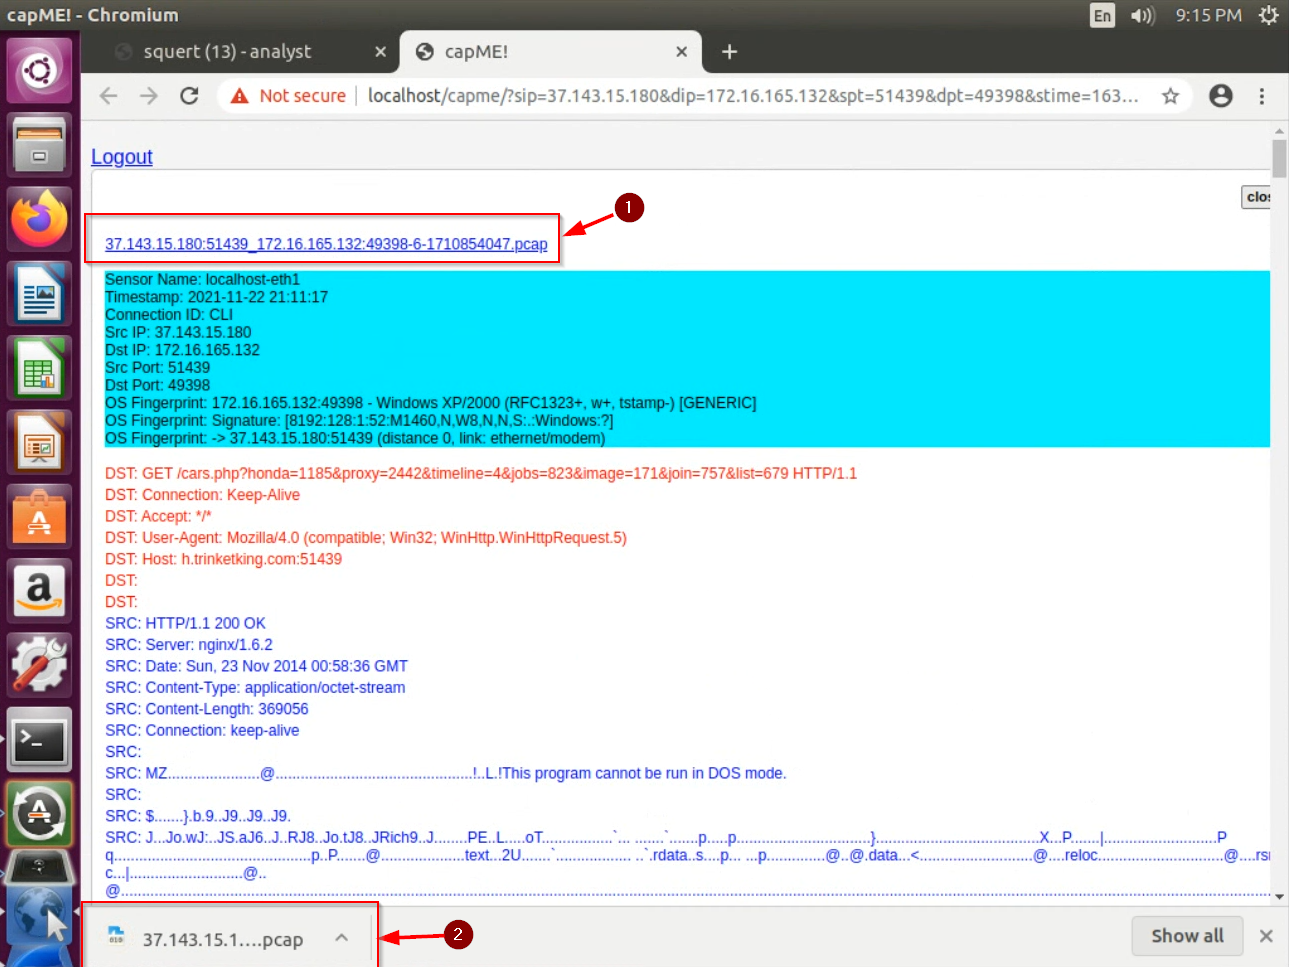
This will pivot to WireShark, another network forensics tool, with a different view of the same event. Unlike the previous tools, WireShark displays one row per packet.
-
Note:
wiresharkcan alternatively be opened either by running thewiresharkcommand from a terminal, or by searching for it from the desktop: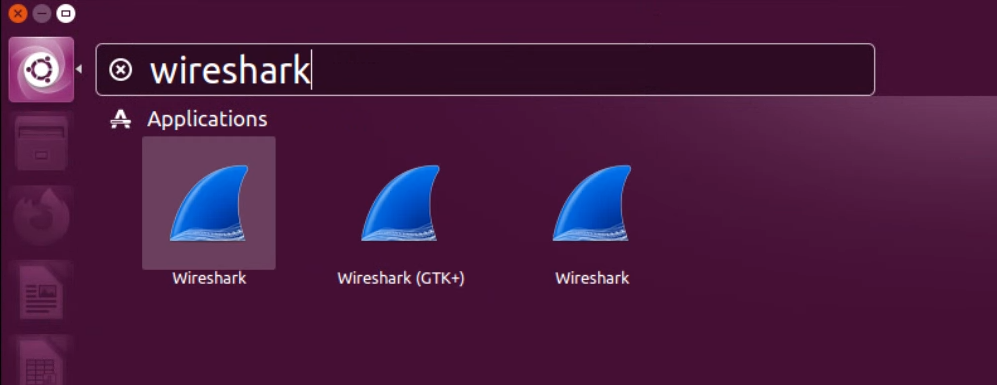
-
The filename at the top of Wireshark indicates the currently opened pcap.
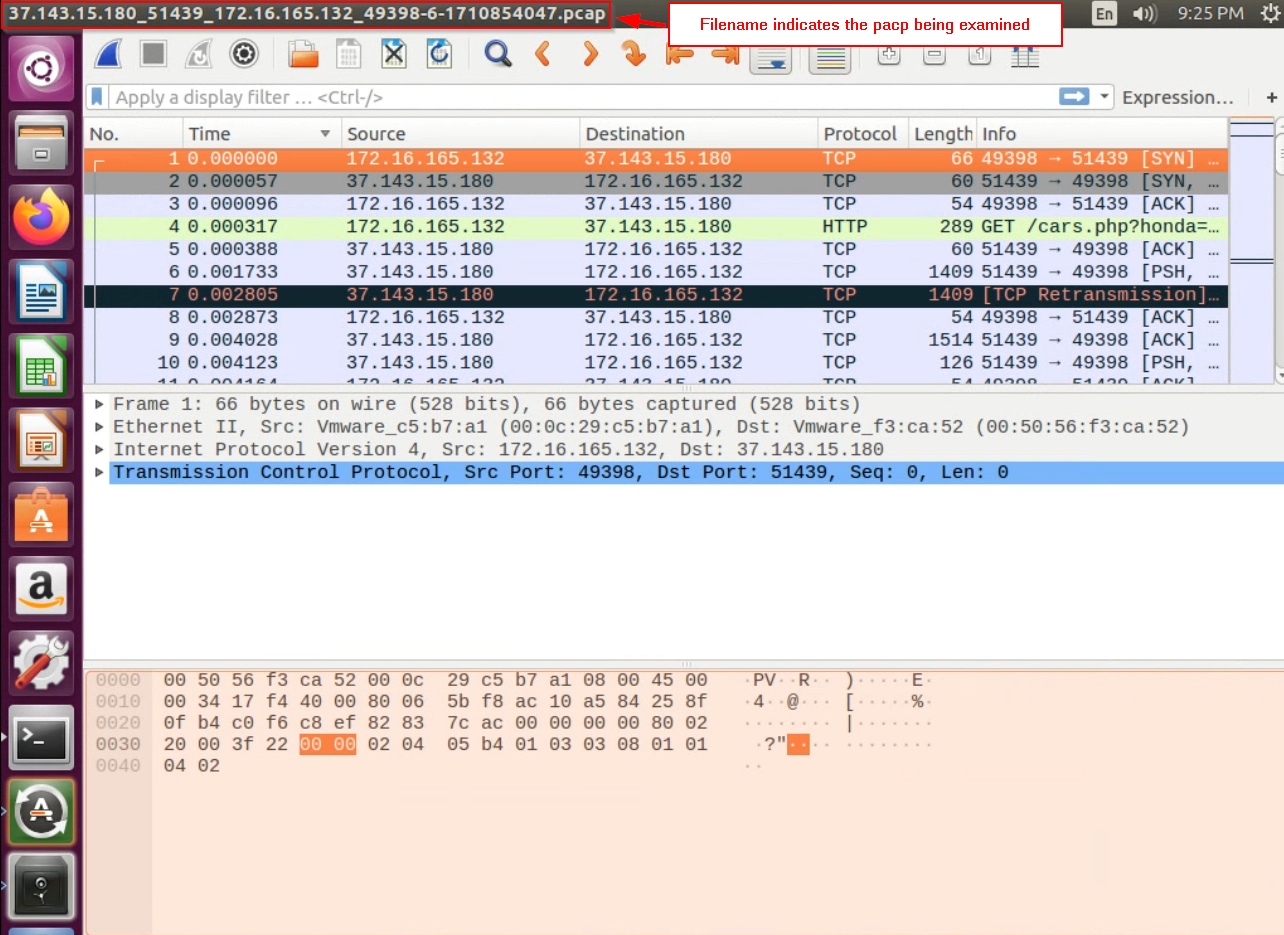
The very first row in the wireshark view shows the packet that the victim sent to the attack machine to begin the request to download the malware payload. Heads up! This means that in this case, the “source” is the victim, and the “destination” is the attack machine.
We are interested in knowing the MAC address of the victim machine so that we can do follow-up analysis. Examine this first packet. Expand the “Ethernet II” frame in the packet view, and note the 6-octet-long address delineated by
:.Question : What is the MAC address of the victim VM? -
-
But what was this host doing that led to them downloading malware? What sent them to that malicious domain? Let’s investigate!
In Wireshark’s File menu, choose “Open,” navigate to
/data/case.pcapfile, click “Open.” This will load the entire traffic file – not just the traffic directly associated with the malware download.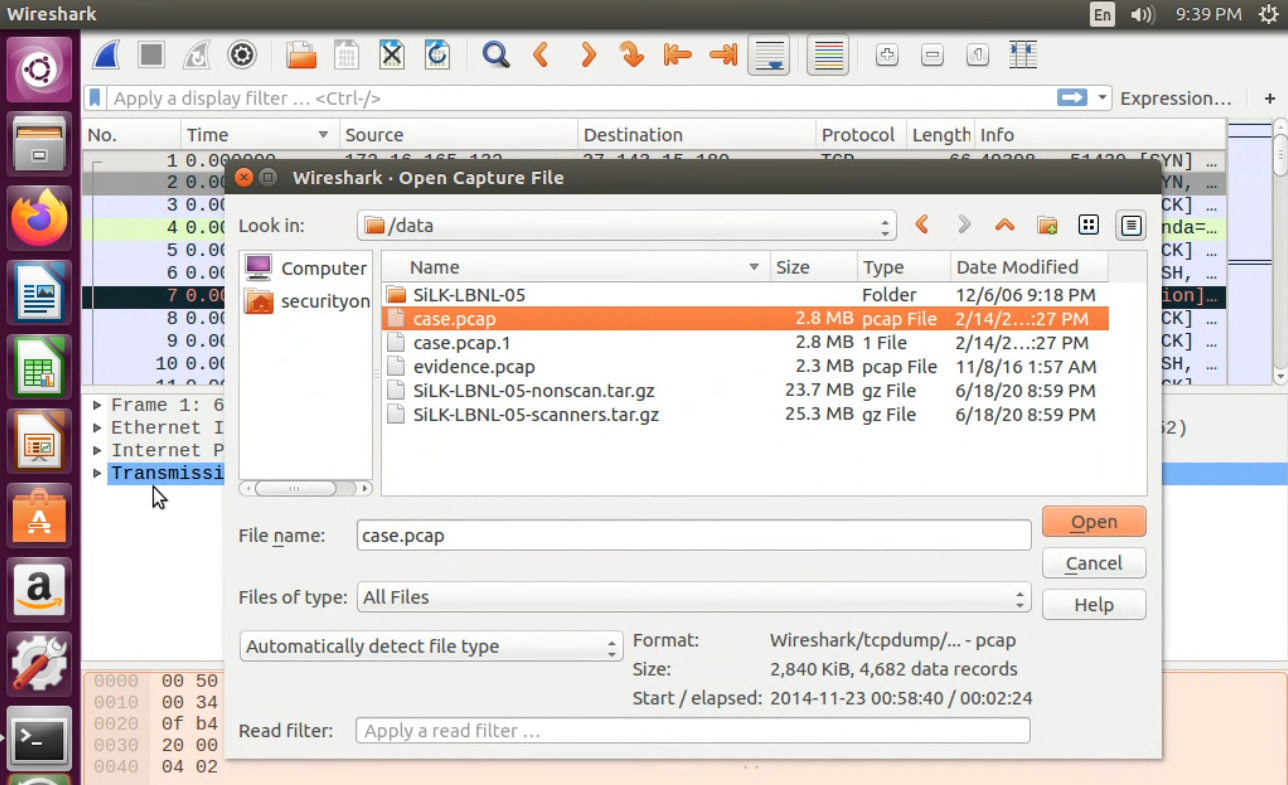
 Pay attention!If you forget use the entire case.pcap file for the following steps, you will have a bad time.
Note the source IP address for packet number 1 in case.pcap. This is the Windows VM that gets infected. This entire network trace only pertains to web-based traffic associated with our victim for a certain time window.
Right-click the first packet, and choose
FollowThenTCP Stream. This will bundle together all of the network packets associated with this single HTTP web request, as didCAPmefor the single HTTP event that resulted in the malware download.Question : What HOST did the victim machine make a request to in the initial TCP session? -
We know from earlier that the malicious HTTP download request included a request for a page located at
/cars.php?honda=1185.... Let’s find that event, and its corresponding stream, by filtering for it with filterhttp contains "cars.php":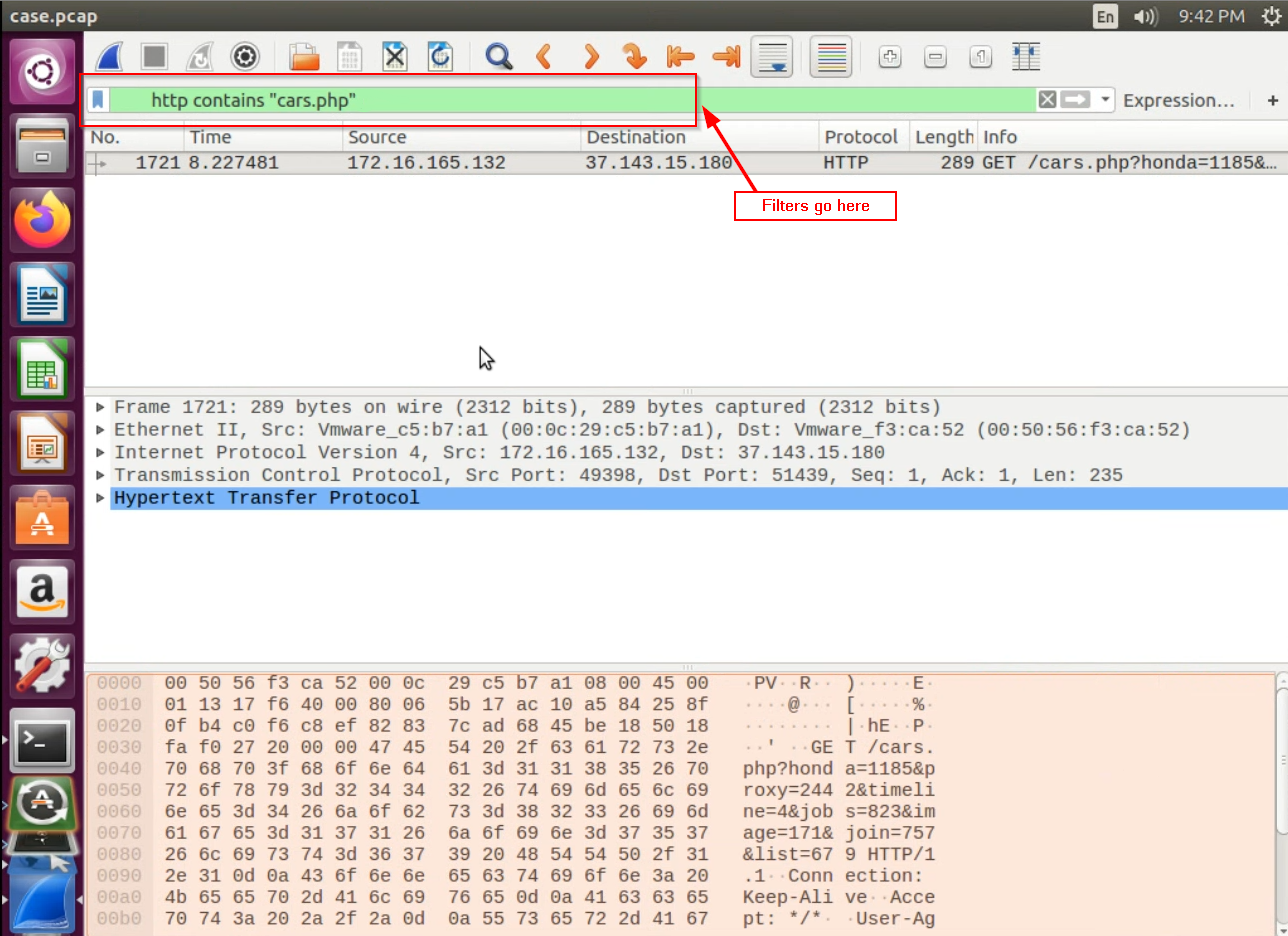
This should return one result – the one web request associated with fetching a route called “cars.php”. For this record, note again the IP address of the malicious host – in this case, the destination ip address.
-
Let’s find all HTTP traffic packets with that destination ip address, to try to find what originally led the victim to that malicious host.
For the single record from the previous step, right-click the destination field value (the ip address), then choose
Apply as Filter>Selected. This will filter the entire tracefile to only activity with a destination ip matching this field. Confirm this by verifying that the filter field now shows the following:ip.dst == 37.143.15.180Let’s filter even further to only select the records with
HTTPprotocol. This can be done by appending “and http” after your “ip.dst ==” filter expression:ip.dst == 37.143.15.180 and httpYou should now see three HTTP requests to this malicious IP. We recognize the second one – the
GET /cars.phpone. It is the one that delivered the malware.Let’s look at the first one – right-click
Follow > TCP Streamit. You will notice that this HTTP request as aREFERERheader. In HTTP, “referer” means the site that redirected the browser to the current one. Note the value for theREFERER. There is a good chance that the referer is a compromised website.Question : What is the domain name of the “referer” website that referred the Windows VM to the IP that delivered the malware? -
We are also interested in knowing the IP address of this referer website – the host at that IP may be hosting other compromised sites, so the network administrators may want to blacklist the address. One way that you can find that IP address is by applying the following wireshark filter:
http contains "Host: name.of.the.referer"Note: this query is case-sensitive. Also, do not include the protocol (e.g.,
http://) or any trailing slashes. By definition, neither of those things are part of the HTTP “Host” field.Question : What was the IP address of this referer website?What could you do with this information?- You could be proactive and contact the website to alert them to their likely compromise.
- You could just block this domain from being accessed within your organization.
-
You could report the compromise to Google, who can put a rule into the Chrome browser to block requests to this domain from being fulfilled. You may have seen a message along these lines in Chrome before:
"The site that you are trying to visit is currently serving malware. Try again later. If you are the domain administrator and are viewing this message, contact us *here* for more information on what we found.
At which point your employees may unfortunately switch to Internet Explorer and visit the site anyway.
-
What exactly was downloaded? Let’s carve it out and search online for a report on what it does.
Return again to the tcp.stream related for the http request fetching
cars.php(review above if you have forgotten how). From the popup window, opt to view as “Raw”, choose “Save As”, and save the stream somewhere.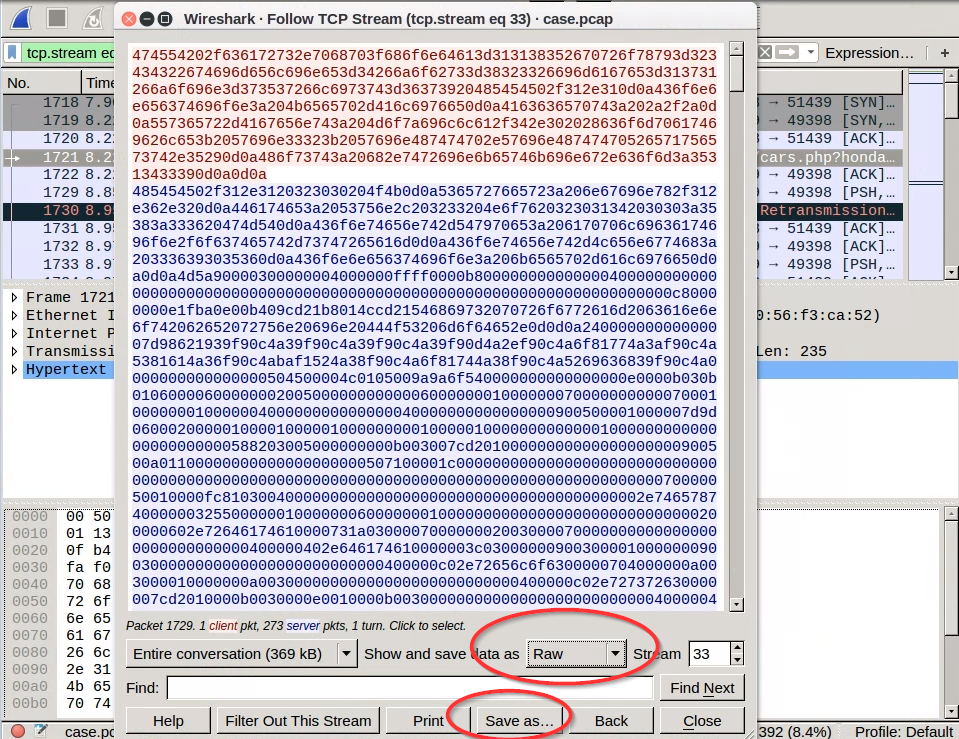 If you do not switch to save the stream as "Raw," then it will be saved by default as ASCII, from which files cannot be carved!
Note the “MZ” string at the top of the blue response stream. This string is a magic number that identifies the file type that is being downloaded in this request (see https://asecuritysite.com/forensics/magic). Note also the
This program…message. This is another indicator that this file is a windows executable. -
Next, open a terminal and navigate to the directory where you saved the stream, and use a forensics file carving tool called Foremost.
Invoke it as follows:
cat <yourfile> | foremost -o OUTPUT_DIRECTORYWith this command,
foremostwill read your file from stdin, and create a directory namedOUTPUT_DIRECTORYcontaining all of the files thatforemostcarved out of the network stream.Inside your carved files directory, you will find a subdirectory for each file type recovered. For this analysis, you should see two subdirectories – one for extracted
pngfiles, and another for extractedexefiles. The.exein theexedirectory is the malware payload.Use a hashing algo such as
sha256sumto hash the extracted.exefile.Question : What is thesha256hash of the exe payload?Browse to a website such as https://virustotal.com or https://hybrid-analysis.com and search the site using the payload’s hash. This can tell you more about what you’re dealing with in your network and potentially how to clean it up.
Question : As shown on virustotal.com, what does Kaspersky antivirus report the exe to likely be?Read about the arrest of, charges against, and plea to conspiracy from Aleksander Panin, the author of the variant of malware with which we are dealing.
Question : What does Brian Krebs indicate this malware is typically used for?For fun: Use the
miragecommand to open the png inside your carved-files directory.If you ever have a storage device that corrupts and is reported to be unreadable by your operating system, it is possible that you can use a tool likeforemostto carve out files from the media.
Part 3: Operation Aurora Case
Case preparation
Begin by resetting Security Onion’s history. Note – this resetting process can take a few minutes to complete.
- Double-click the “Setup” icon on the Security Onion desktop, and enter the password “Password1”.
- Click “Yes, Continue!” on the first pane.
- Click “Yes, skip network configuration!”
- Click OK with the default setting of “evaluation mode.”
- Click OK with the default setting of “eth1” for the monitoring interface.
- Enter “analyst” for the Sguil username.
- Enter “analyst” for the Sguil password, and confirm.
- Click “Yes, proceed with changes!”
- Click OK on the remaining dialog messages.
The logs on Security Onion have been reset, giving you a clean slate for the case below.
Case Scenario
You will use all the skills you’ve learned in this lab so far to solve the following case based on a real hack called Operation Aurora. First, watch this video or read this Wikipedia article about Operation Aurora, which was an attack on Google and other companies. Then, read the following scenario:
Claire Young is after GumTiger’s killer app source code. She’s been trailing the lead developer, Alex Stephens, to figure out how she can remotely access GumTiger’s servers. One night, while conducting reconnaissance, she sees him log into his laptop
10.10.10.70and VPN into GumTiger’s headquarters.Leveraging her connections with international hacking organizations, Claire obtains a 0-day exploit for Internet Explorer and launches a client-side spear phishing attack against Alex Stephens. Claire carefully crafts an email to Alex containing tips on how to improve the source code and sends it. Seeing an opportunity that could get him that Vice President of Product Development title (and corner office) that he’s been coveting, Alex clicks on the link. Claire is ready to strike…
You are the forensic investigator. Your mission is to analyze the packet capture containing Claire’s exploit, build a timeline, and answer the questions below.
-
Download the packet capture evidence file,
evidence.pcap, into the/datafolder:/data$ sudo wget -O evidence.pcap https://github.com/deargle/lab-security-onion/raw/master/evidence.pcapYou can use
evidence.pcapfile as you didcase.pcap, including tcp-replaying it and opening it in Wireshark. -
Find the full URL of Alex Stephens’ original web request, including the port.
Question : What was the full URI of Alex Stephens’ original web request? (Please include the port in your URI.)Hint: Squert will not help you in this part of the case – instead, load the
evidence.pcapfile into Wireshark and look forhttptraffic.The reason why the Squert alerts will not help to find the original HTTP request will be more clear in Step 4.
-
In response, the malicious web server sent back obfuscated JavaScript, which contained a zero-day exploit. Near the beginning of this JavaScript code, the attacker created a javascript array named “UWnHADOfYHiHDDXj” with 1300 “COMMENT” HTML elements, then set the
dataproperty of each of those elements to a string. What was the value of this string? (hint: look for.dataa few lines down within the loop.Question : What was the string value of javascript variable “UWnHADOfYHiHDDXj”?JavaScript is the programming language that makes webpages interactive. With it, code can dynamically create and manipulate HTML elements on a webpage. While a web server sends basic html in response to a page request, any javascript is executed on the client's browser, not on the server. That is important -- any code that can be executed on your own computer can potentially do bad things to your computer! Web browsers such as Internet Explorer are designed to not allow code like javascript to do anything outside of the scope of the webpage you are viewing... but this 0-day escapes the jail of the browser.
The Symantec analysis above reports that:
This exploit was used to deliver a malicious payload, known by the name of Trojan.Hydraq, the main purpose of which was to steal information from the compromised computer and report it back to the attackers.
The exploit code makes use of known techniques to exploit a vulnerability that exists in the way Internet Explorer handles a deleted object. The final purpose of the exploit itself is to access an object that was previously deleted, causing the code to reference a memory location over which the attacker has control and in which the attacker dropped his malicious code.
The payload is created with the javascript
var LLVcUmerhpt, and the memory is manipulated by overwriting those earlier.dataproperties with a value which be interpreted as a memory address and which will cause the browser to execute the payload from that attacker-chosen location in memory. -
The loaded webpage included an IFRAME element which caused Alex’s computer to make a second HTTP GET request for an object.
Question : What was the filename of the second HTTP object that was requested?Question : What is the MD5 hash of the second file requested (the second HTTP response object)?Hint:
- You can first filter to
httptraffic withGETrequests, and note the name and properties of the second one. Then, You can useforemostto extract the http response object from a saved copy of the http tcp stream. - Alternatively and equivalently, you can export HTTP response objects in Wireshark by going to the wireshark
Filemenu, and selecting “Export Objects” > HTTP. You should see two “HTTP”-requested objects. The first is the initial webpage visited, and the second is a gif, the downloaded of which was triggered by the initial webpage loaded. Note the name of the second file requested. Save the second one to a file. This saved file is the equivalent of whatforemostwould have carved.
- You can first filter to
-
The exploit javascript from the first HTTP object did some over-my-head crazy magic with the second HTTP object that involved overwriting its location in memory with a payload. The javascript gets the payload to execute, and the payload opened a TCP session on port 4444 between Alex’ computer and Claire’s machine.
This is the heart of the trick -- javascript is not supposed to be able to write programs to memory and get them to execute, the browser is supposed to be sandboxed from the rest of the system. Yet, the vulnerability lets the javascript write a program to memory and get it to run outside of the browser.Find the packet for when the TCP session on port 4444 opened, and also find the one when it closed. Use the timestamp difference between these two to determine how long the port was open. This is significant because it tells us how long the attackers had to perform their attack.
Hint:
- Use the Wireshark filter
tcp.port == 4444. For the time, see the value in Wireshark’s “Time” column for the first row in the filtered results. - Right-click the first packet in the filtered results, and choose
Set Time Reference. Then note the time value for the last row in the filtered results. With the first set as the time reference, the last packet will indicate how long this tcp stream was open.
Question : How long was the TCP session on port 4444 open?The reason why Squert would not show any HTTP request information for this malware download is because... this malware was not directly downloaded via an HTTP request! This malware was downloaded by a program written to memory and executed by javascript, which javascript was sent in the original web request. - Use the Wireshark filter
-
In packet 17, the malicious server began to send a file to the client over the port 4444 TCP session. What type of file was it?
Hints:
- Examine the magic number at the beginning of the download data
- Extract the downloaded file from the tcp stream associated with packet 17, carve out the files, and use the
filecommand from the terminal.
Question : What type of file was it, according to the magic number and to thefilecommand?Question : What was the MD5sum of this file? -
Search for a hash of the downloaded file on https://www.virustotal.com/ and on https://www.hybrid-analysis.com/.
Question : What type of file is this, according to hybrid-analysis and Virustotal? -
You notice that the victim’s computer repeatedly tried to connect back to the malicious server on port 4445, even after the original connection on port 4444 was closed.
Eventually, the malicious server responded and opened a new connection on port 4445.
Subsequently, the malicious server sent a second executable file to the client on port 4445.
Question : What was the MD5 sum of this second, new executable file downloaded over the port 4445 TCP session?Hints:
- Search for traffic with this new port. You will see a lot that are red and black – these are failed connection attempts. The black is the victim sending TCP SYN packets to the attackbox port 4445, and the RST/ACK response is the attack box indicating that the port is closed.
- Eventually, the attackbox responds with SYN/ACK – port is open and ready for business, establish the TCP session! The remainder of the tcp session is spent downloading the executable.
-
You can be square and just scroll around until the colors change, indicating a successful connection, or you can be cool and use the power of wireshark filters. Try this one, which will give you the start of the TCP stream that downloaded the second file:
tcp.port == 4445 and tcp.flags.syn == 1 and tcp.flags.ack == 1
Sources
- http://malware-traffic-analysis.net
- http://forensicscontest.com/2010/05/21/puzzle-6-anns-aurora (wayback link)
- McManus, Joe. Using Net Flow Data for Incident Response. Nov 2014. University of Colorado Boulder